As human beings, we have a natural migrating culture that has been around for centuries. The reason behind this change varies with every season. What doesn’t change is our want and need to move organically to try new things in new surroundings, and then there are the circumstances where we sometimes have no choice but to move because of natural causes, poverty, or political reasons. We change daily as a race and population. And so we make it a priority to keep us informed about the current trends so that we can continue to provide you with the best-tailored service possible.
Here at Walkerscott we are continually striving to gain insight into the data around us. As migration is a topic of interest, we extracted data from the Australian Bureau Statistics (ABS) to provide insight on the latest migration statistics. This was done in six easy steps with Microsoft Power BI
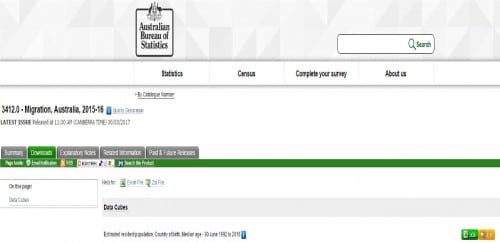
1. Download content from Australian Bureau Statistics (ABS) (.xls format)
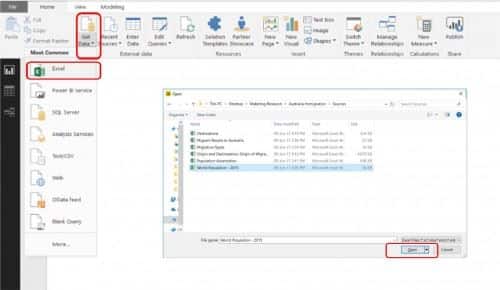
2. Using Power BI Desktop Version – Get data and open dataset
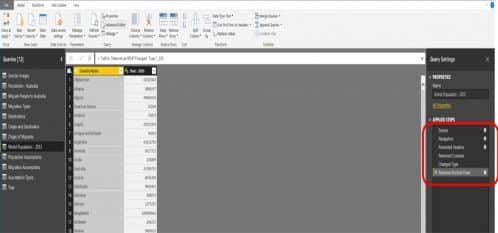
3. Edit datasets in Query Editor. Note, there are several data and structure transformations we can apply at this stage
- Add/remove columns or rows
- Transform data (Trim text, Uppercase, Lowercase, Clean)
- Remove Duplicates or Errors
- Use Parameters
- Group Text
- Pivot or Unpivot Table
- Split Column
- Run R Script
- Change data type
- Build custom functions
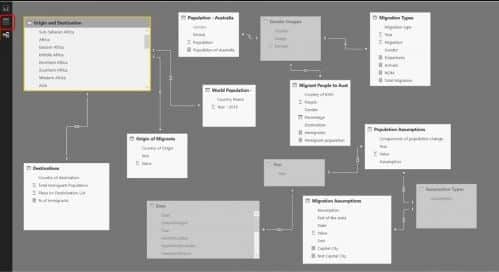
4. Build the model at relationship tab
A relationship between different data sources enables Microsoft Power BI to know how tables are related and allows us to optimise our queries. A relationship can be one-to-one, one-to-many or many-to-one.
5. We can add new calculated measures or columns to our tables
6. At report tab, we can build our reports choosing from different visualisations and fields
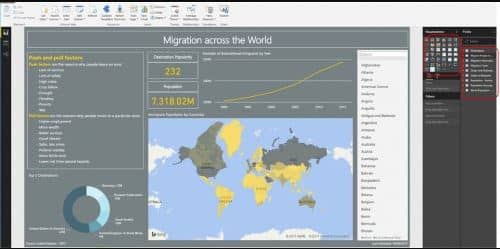
View the results from the Australian Bureau Statistics in the Report below
On the first page of the report, we have given a global overview of how many people migrated from country to country and what their top destinations are. You will also see the trends in migration and population over the past 25 years. What is more interesting is the push and pull factors that cause people to leave their home.
Secondly, we focus specifically on Australia and providing more detailed information about the migrant population. You can use the Chicklet Slicer to filter the reports by genders and examine Net Overseas Migration over the last 12 years. ABS assumed that almost 200.000 people arrived in the period 2015-2016. We do not have to wait too long for the result as they will soon release the 2016 Census results.
And then finally we are displaying three possible assumptions depending on how the components of the population change. You will see that the future population could hit 70 million by 2101. It is interesting to see the proportion of the urban migration and the destination across Australia as well.
Get in touch with us if you have any questions on extracting your data. You can call us on Australia: 1300 490 795 New Zealand: 0800 111 728 or email us on hello@walkerscott.co


