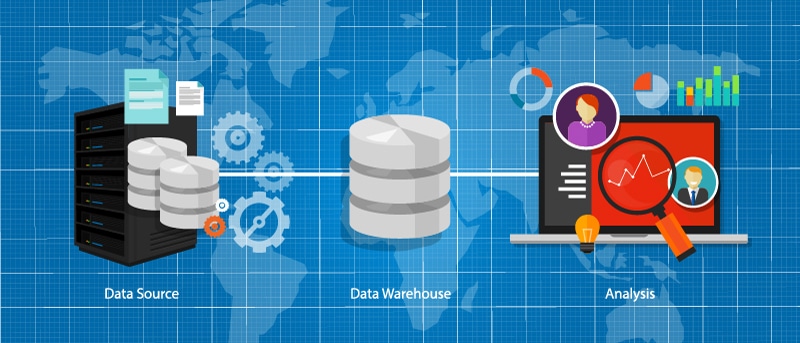
A data warehouse is a subject-oriented, integrated, time-variant and non-volatile collection of data in support of management’s decision-making process.
Great.
But what do these terms actually mean?
- Subject-Oriented: A Data warehouse is built and used to analyse any subject/ department of an Enterprise. For example, Sales, Finance, Marketing, Supply Chain, and so on.
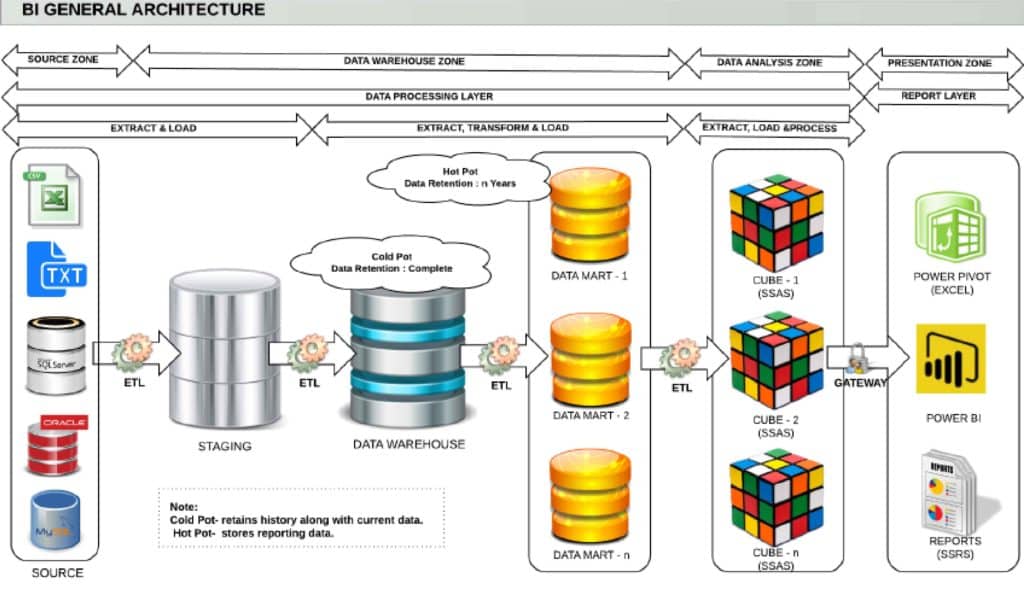
- Integrated: A Data warehouse integrates data from multiple data sources into a single repository. As per the image below, data is first loaded into a Staging layer and then merged and transformed in subsequent layers, in preparation for reporting and other intelligence activities.
- Time-Variant: Historical data is kept in a data warehouse. Data can be retrieved as it was at a point in time in the past. This contrasts with a transactional system (such as Microsoft Dynamics, SAP, Xero, MYOB), where only the current record of data is stored. For example, a transactional system may hold the current address of a customer, whereas a data warehouse will hold the current address and all historical addresses associated with a customer.
- Non-volatile: Once data is in the data warehouse, it will not change. So, historical data in a data warehouse should never be altered, enabling analysis and comparisons over different time periods and other dimensions.
Here is a breakdown of the above visual
- Source: This refers to source data that will be loaded into the data warehouse. Modern data warehousing tools can ingest a variety of different data sources, from more traditional, well-structured sources like SAP or Oracle, to less traditional, decentralised cloud applications, all the way through to more unstructured web and social media data. To use a Farm to Table analogy, the source layer is akin to farms where food is grown and produced.
- Staging: The Staging layer is where different sources are loaded into a common location, in advance of preparation for reporting and analysis. Think of this as being like the stockroom in a kitchen; there is meat, vegetables, dairy, and many other raw materials, waiting to be transformed into ingredients for a delicious meal.
- Data Warehouse/Data Marts: Data Marts typically correspond to specific business areas. So, you may have a Finance data mart which could contain data from different financial systems, a Sales data mart which could contain data from Sales and CRM systems, and so on. Data in the Data Marts is sometimes referred to as “Hot” data and needs to be accessible constantly, so is refreshed frequently. “Colder” data which needs to be accessed less frequently, is usually stored further back in the Data Warehouse and is not refreshed as frequently. It is useful to think of the Data Marts as the preparation area in a kitchen, where ingredients are sliced, seasoned, and cooked in preparation for serving.
- Analysis and Presentation: This is the moment we have all been waiting for: the presentation of our meal. The final layers in a Data Warehouse are the analysis and presentation layers. In the image above, data cubes are developed to allow for deep analysis of the data in specific data marts. This is usually done via Excel or Power BI and enables users to combine complex data queries quickly and easily to support decision-making. The presentation layer traditionally referred to fixed reports, presenting a specific set of queries. However, with the advent of self-service BI tools such as Power BI, the presentation layer is becoming more powerful and more interactive, allowing for deeper analysis and exploration.


